Over on Instagram, I did some careerstatistics using USPSA Analyst. Since the data I have easy access to is for major matches only, and a date-limited set besides, those ‘career’ statistics were necessarily partial.
Now that the latest version of USPSA Analyst is released, you can run career statistics for yourself, including every match you’ve shot, locals too. Here’s how.
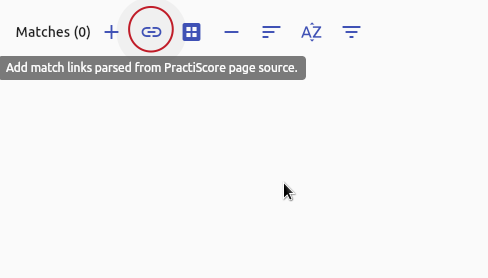
1. Go to the ratings configuration page (bottom right button on the home screen) and create a new project for your match list.
2. Select the ‘parse PractiScore page source’ option.
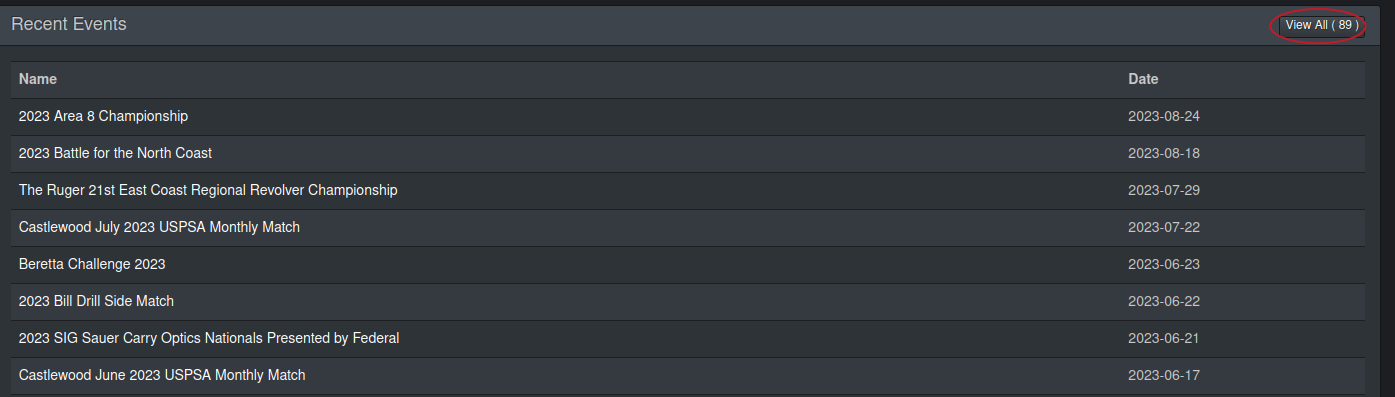
3. Go to your PractiScore dashboard and click the ‘View All’ button under ‘Recent Events’.
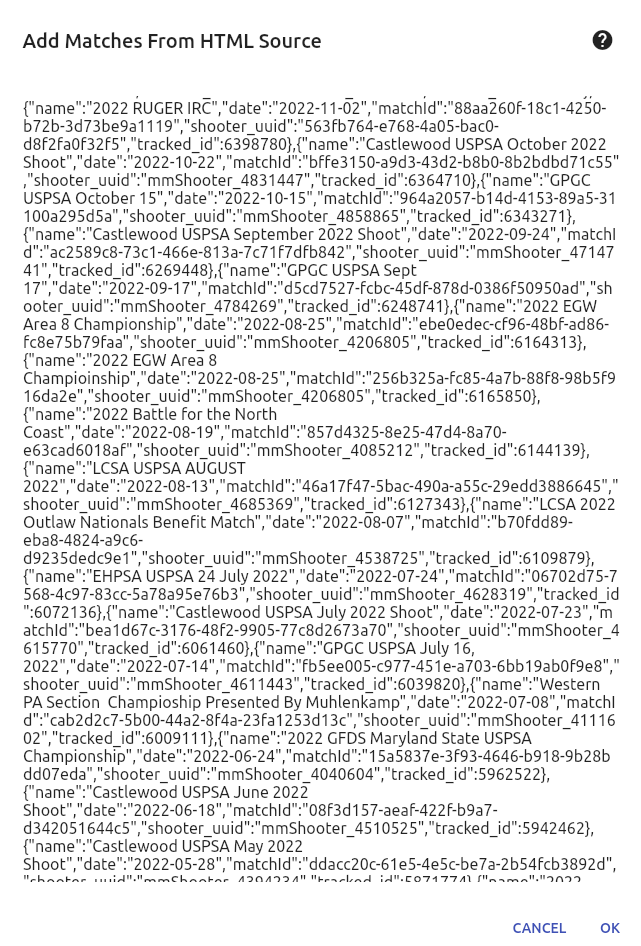
4. Right-click on the resulting page and click ‘view page source’.
To be sure you have the right page source, Ctrl+F to search for ‘matchid’ in the output.
5. Copy and paste the page source into the dialog in USPSA Analyst.
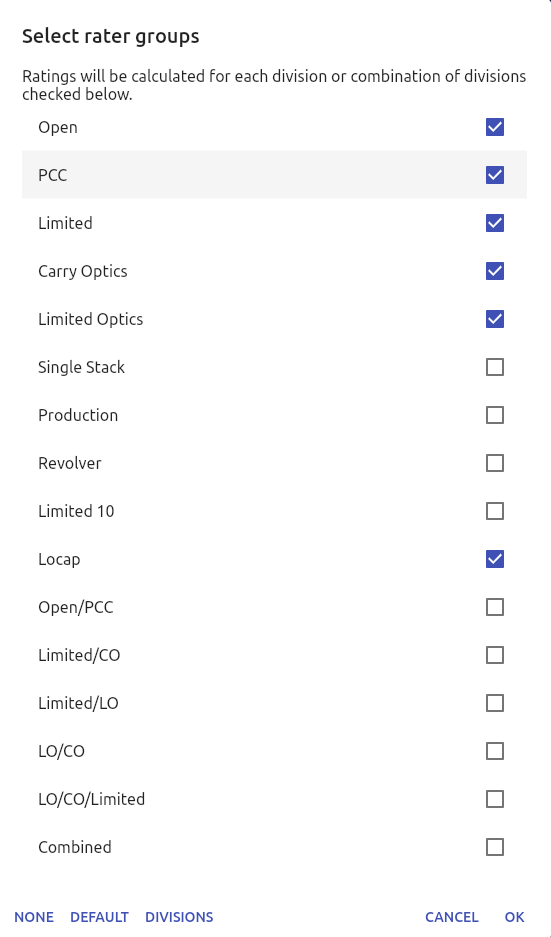
6. If you have participated in multiple divisions and want to combine your statistics, tap the edit button next to ‘Active rater groups’.
Click ‘None’, then ‘Combined’.
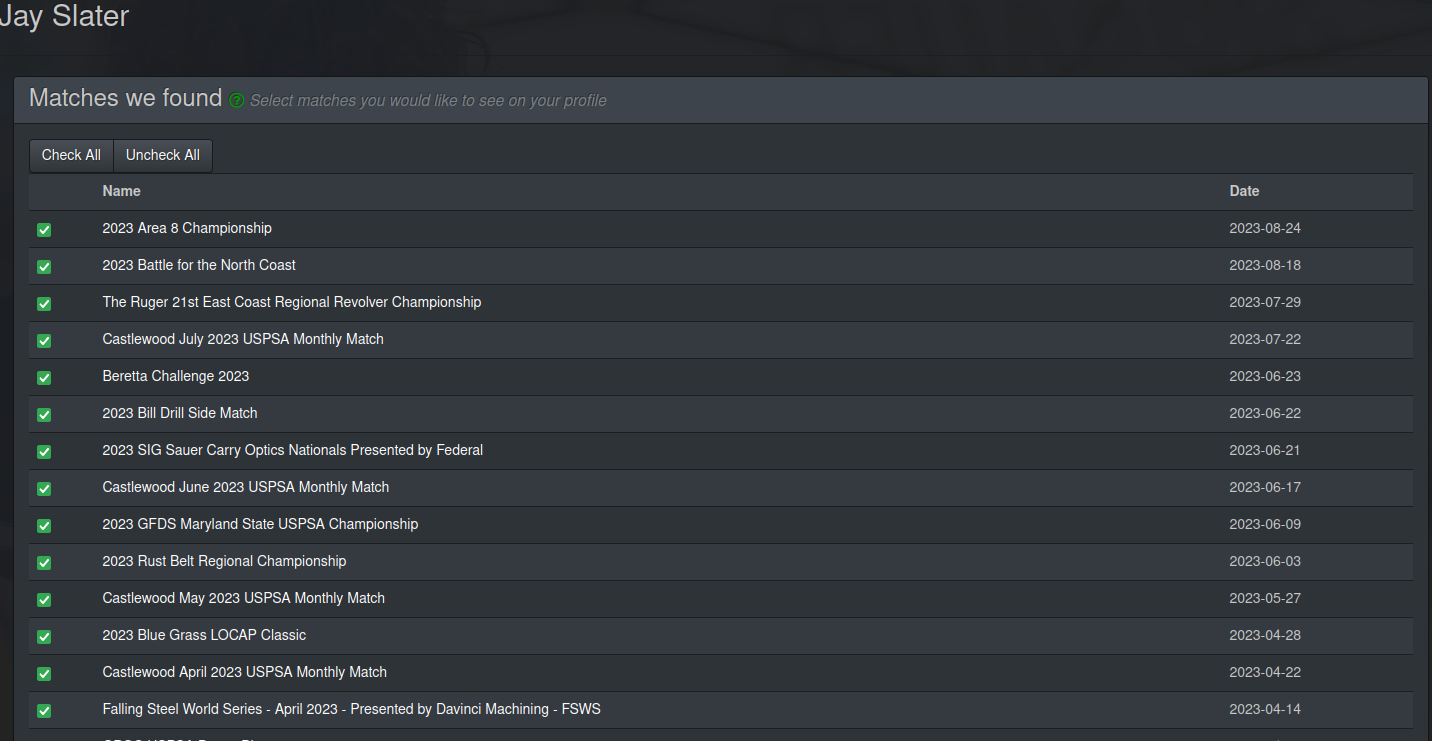
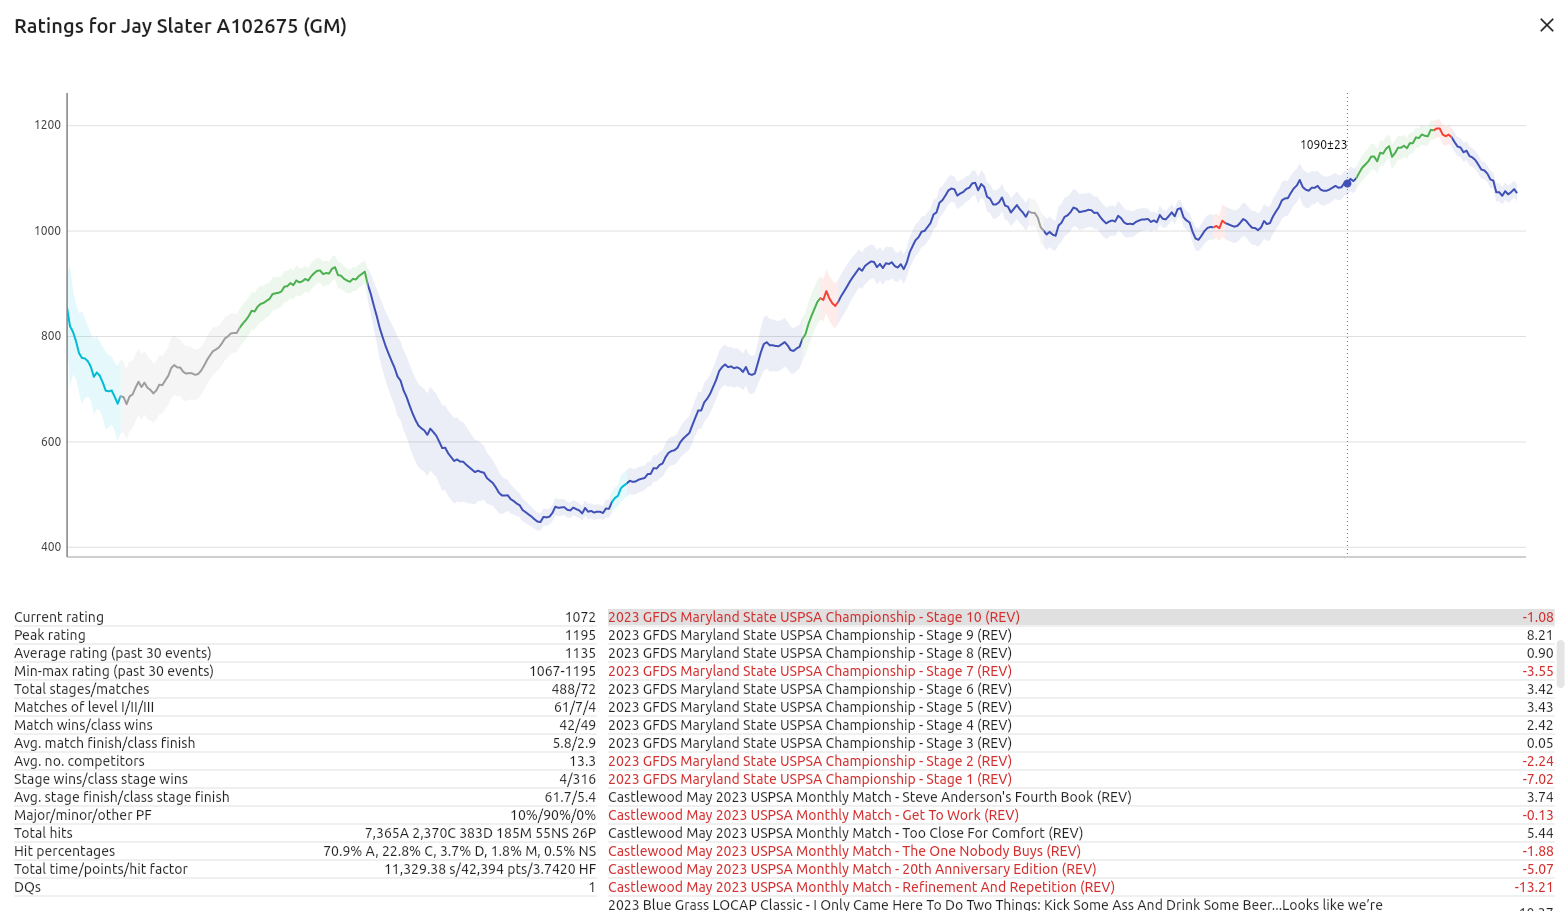
7. Click ‘Advance’, use the search box to find yourself in the ratings, click on your row, and enjoy your career stats.
In USPSA circles these days, I’m known in roughly equal measure for being ‘that East Coast revolver guy’ and ‘that Instagram Elo ratings guy’. This post is about the second topic. In particular, it’s a simple, mostly non-mathematical primer about Elo ratings in general, and Elo ratings as I have applied them to USPSA with the tool I call USPSA Analyst1.
This article is up to date as of September 2023. It may not be up to date if you’re reading it later on, and it may not be fully complete, either—this is not meant to be full documentation of Analyst’s guts (that’s the source code), but rather a high-level overview.
Elo basics
The Elo2 rating system was first developed to measure the skill of chess players. Chess is what we call a two-player, zero-sum game: in tournaments, each chess game is worth one point. If there’s a draw, the two players split it. Otherwise, the winner gets it. Elo operates by predicting how many points a player ought to win per game, and adjusting ratings based on how far the actual results deviate from its predictions.
Let’s consider two players, the first with a rating of 1000, and the second with a rating of 1200. The second player is favored by dint of the higher rating: Elo expects him to win about 0.75 points per game—say, by winning one and drawing the next, if there are two to be played. If player 2 wins a first game, his actual result (1 point) deviates from his expected result (0.75), so he takes a small number of rating points from player 1. Player 2’s rating rises, and player 1’s rating falls. Because the deviation is relatively small, the change in ratings is relatively small: we already expected player 2 to win, so the fact that he did is not strong evidence that his rating is too low. Both players’ ratings change by 10: player 2’s rating goes up to 1210, and player 1’s rating goes down to 990.
On the other hand, if player 1 wins, his actual result (1 point) deviates from his expected result (0.25) by quite a lot. Player 1 therefore gets to take a lot of points from player 2. We didn’t expect player 1 to win, so his win is evidence that the ratings need to move substantially to reflect reality. Both players’ ratings change by 30, in this case: player 2 drops to 1170, and player 1 rises to 1030.
The amount of rating change is proportional to the difference in rating between the winner and loser. In Elo terms, we call the maximum possible rating change K, or the development coefficient3. In the examples above, we used multiplied by the difference between expected result and actual result4: makes 10, for the rating change when player 2 wins, and makes 30, for when player 1 wins.
Expected score can be treated as an expected result, but in the chess case, it also expresses a win probability (again, ignoring draws): if comparing two ratings yields an expected result of 0.75, what it means is that Elo thinks that the better player has a 75% chance of winning.
There are a few things to notice here:
Standard Elo, like chess, is zero-sum: when one player gains rating points, another player must lose them.
Standard Elo is two-player: ratings change based on comparisons between exactly two players.
Elo adjusts by predicting the expected result a player will attain, and multiplying the difference between his actual result and expected result by a number K.
When comparing two ratings, Elo outputs an expected result in the form of a win probability.
Elo for USPSA
Practical shooting differs from chess in almost every way5. Beyond the facially obvious ones, there are two that relate to scoring, and that thereby bear on Elo. First, USPSA is not a two-player game. On a stage or at a match, you compete against everyone at once. Second, USPSA is not zero-sum. There is not a fixed number of match points available on a given stage: if you win a 100-point stage and another shooter comes in at 50%, there are 150 points on the stage between the two of you. If you win and the other shooter comes in at 90%, there are 190 points.
The first issue is simple to solve, conceptually: simply compare each shooter’s rating to every one of his competitors’ ratings to determine his expected score6. The non-zero-sum problem is thornier, but boils down to score distribution: how should a shooter’s actual score be calculated? The article I followed to develop the initial version of the multiplayer Elo rating engine in Analyst has a few suggestions, but the method I settled on has a few components.
First is match blending. In stage-by-stage mode (Analyst’s default), the algorithm blends in a proportion of your match performance, to even out some stage by stage variation7. If you finished first at a match and third on a stage, and match blend is set to 0.3, your calculated place on that stage is , rewarding you on the stage for the match win.
Second is percentages. For a given rating event8, the Elo algorithm in Analyst calculates a portion of actual score based on your percentage finish. This is easy to justify: coming in 2nd place at 99.5% is essentially a tie, as far as how much it should change your rating, compared to coming in 2nd place at 80%. The percentage component of an actual score is determined by dividing the percent finish on the stage by the sum of all percent finishes on the stage. For instance, in the case of a stage with three shooters finishing 100%, 95%, and 60%, the 95% finisher’s percentage contribution to actual score is .
The winning shooter gets some extra credit based on the gap to second: for his actual score, we treat his percentage as , where P is the percentage of the given shooter. For example, , for an actual score of about 0.404 against 0.392 done the other way around9.
Analyst also calculates a place score according to a method in the article I linked above: the number of shooters minus the actual place finish, scaled to be in the range 0 to 1. Place and percent are both important. The math sometimes expects people who didn’t win to finish above 100%, which isn’t possible in our scoring, but a difficult constraint to encode in Elo’s expected score function. (Remember, the expected score is a simple probability, or at least the descendant of a simple probability.) Granting points for place finish allows shooters who aren’t necessarily contesting stage and match wins to gain Elo even in the cases where percentage finish breaks down. On the other hand, percentage finish serves as a brake on shooters who win most events they enter10. If you always win, eventually you need to start winning by more and more (assuming your competition isn’t getting better too) to keep pushing your rating upward.
Percent and place are blended similar to match/stage blending above, each part scaled by a weight parameter.
That’s the system in a nutshell (admittedly a large nutshell). There are some additional tweaks I’ve added onto it, but first…
The Elo assumptions I break
Although the system I’ve developed is Elo-based, it no longer follows the strict Elo pattern. Among a bevy of minor assumptions about standard Elo that no longer hold, there are two really big ones.
Number one: winning is no longer a guaranteed Elo gain, and losing is no longer a guaranteed Elo loss. If you’re a nationally competitive GM and you only put 5% on the A-class heat at a small local, you’re losing Elo because the comparison between your ratings says you should win by more than that. On the flip side, to manufacture a less likely situation, if you’re 10th of 10 shooters but 92% of someone who usually smokes you, you’ll probably still gain Elo by beating your percentage prediction.
Number two: it’s no longer strictly zero-sum. This arises from a few factors in score calculation, but the end result is that there isn’t a fixed pool of Elo in the system based on the number of competitors. (This is true to a small degree with the system described above, but true to a much larger degree once we get to the next section.)
Other factors I consider
The system I describe above works pretty well. To get it to where it is now, I consider a few other factors. Everything listed below operates by adjusting K, the development coefficient, for given stages (and sometimes even individual shooters), increasing or decreasing the rate of rating change when factors that don’t otherwise affect the rating system suggest it’s too slow or too fast.
Initial placement. For your first 10 stages, you get a much higher K than usual, decreasing down to the normal number. This is particularly useful when new shooters enter mature datasets, allowing them to quickly approach their true rating. Related to initial placement is initial rating: shooters enter the dataset at a rating based on their classification, between 800 for D and 1300 for GM.
Match strength. For matches with a lot of highly-classified shooters (to some degree As, mostly Ms and GMs), K goes up. For matches heavier on the other side of the scale, K goes down.
Match level. Level II matches have a higher K than Level I, and Level III matches have a higher K than Level II.
DQs and DNFs. When a shooter DNFs a stage (a DNF, in Analyst, is defined as zero time and zero hits), that performance is ignored for both changing his own rating, and contributing to rating changes for other shooters. If match blend is on in stage-by-stage mode, it is ignored for DQed shooters. In by-match mode, DQed shooters are ignored altogether.
Pubstomps. If the winning shooter at a match is an M or GM, two or more classes above the second place finisher, and the winner by 25% or more, his K is dramatically reduced, on the theory that wins against significantly weaker competition don’t provide as much rating-relevant information as tighter finishes. This mostly comes into play in lightly-populated divisions.
Zero scores. Elo depends on comparing the relative performances of shooters. One zero score is no different from any other, no matter the skill difference between the shooters, so the algorithm can’t make any assumptions about ratings based on zero scores. If more than 10% of shooters record a zero on a stage, K is reduced.
Network density. Elo works best when operating on densely-connected networks of competitors. The network density modifier (called ‘connectivity’ or ‘connectedness’ most places in the app) increases K when lots of shooters at a given match have recently shot against a lot of other shooters, and decreases K when they haven’t. In a sense, connectivity is another measure of rating reliability: someone with low connectivity might be an artifact of an isolated rating island, shooting against only a few people without exposure to shooters in the broader rating set.
Error. Rating error is a measure of how closely a shooter’s actual scores and expected scores have matched recently. If the algorithm’s predictions have been good, error gets smaller, and K also gets smaller. If the algorithm’s predictions have been bad, error gets bigger, and so does K, to help the rating move toward its correct value more quickly. This is an optional setting, but is currently enabled by default.
Direction. Direction is a measure of how positive or negative a shooter’s recent rating history is: positive direction means that recent events have generally led to increases in rating, with 100 meaning that every recent change is a positive change. Direction awareness increases K when a shooter has highly positive or negative direction and is moving in that direction, and decreases K when a shooter moves opposite a strong direction trend11. Direction awareness is an option, currently disabled by default.
Bomb protection. Bomb protection reduces the impact of single bad stages for highly-rated shooters. Because people with above-average ratings lose much more on the back of a single bad performance than they gain because of a single good performance, ratings can unfairly nosedive in the case of, say, a malfunction or a squib. Bomb protection attempts to detect these isolated occurrences, and reduces K significantly for them. Repeated bad performances lose protection, and allow the rating to begin moving freely again. Bomb protection is an option, currently disabled by default.
In 2024, bomb protection and direction awareness will be enabled for the main ratings I do. Notably, these make the ratings slightly less accurate at predicting match results. It’s sufficiently small an effect that it may not be statistically significant, and it also substantially improves the leaderboards according to the experts who have seen the output. At the same time, the predictions will continue to use the 2023 settings, since (again) they are slightly but consistently more accurate.
In any case, that’s the quick (well, quick-ish) tour of Elo ratings for USPSA. Drop me a comment here, or a DM on Instagram (@jay_of_mars) if you have questions or comments.
The name may change at some point, if USPSA asks, to avoid stepping on their trademark. At the time of writing, I’m not affiliated with USPSA, and they have not publicly sanctioned my work (in either the positive or negative sense of ‘sanction’). ↩
Not ELO— the system is named after its inventor, Hungarian-American physics professor Arpad Elo. It’s pronounced as a word (“ee-low”), not as an initialism (“ee-el-oh”). ↩
You’ll find ‘development coefficient’ in other sources, mostly. I always call it ‘K’. ↩
I will probably refer to these as ‘expected score’ and ‘actual score’ elsewhere in the article. They’re the same thing. ↩
Expected scores and actual scores are scaled so that they sum to 1 across all competitors. This is mainly for convenience and ease of reasoning. ↩
Some, but not all. Stage-by-stage mode works better in my experience: the more comparisons an individual shooter has, the better the output, even if winning stages isn’t quite what we’re measuring in USPSA. ↩
A rating event is a stage, in stage-by-stage mode, or a match in match-by-match mode. ↩
Writing this article, I realize I should probably be making the adjustment for every shooter, but that’ll have to wait until the 2024 preseason12. ↩
I’m a good example of the latter: Analyst isn’t willing to bump my rating by very much at most revolver matches, because it’s expecting me to put large percentages on the field. ↩
The reasoning here is that a shooter whose rating matches his current level of skill should have a direction near 0, which is to say a 50-50 mix of positive and negative changes. ↩
There’s probably a more correct way to generate percentage-based scores in general, but I haven’t set upon it yet, even if I have a few ideas of where I’m not quite on track. ↩


 makes 30, for when player 1 wins.


 , for an actual score of about 0.404 against 0.392 done the other way around